In our previous posts, we described what the fluorescent method is, and where should it be applied. But is the fluorescent method validated microbiologically? How can we know that the shining areas are really disinfected? Now, we discuss it.
One of the first studies that compared the distribution of the fluorescent dye with microbiological samples was carried out by Widmer and Dangel 2004. They tested hand hygiene technique of trained infection control professionals, hospital epidemiologists and students. They measured highly variable log10 reduction values, from 0 to 3.85. One of the main limitations of their study was that although they inspected the entire hand with the fluorescent method, for microbiological sampling they used the fingertip method. That means, only the five fingertips were placed to the plate for culturing.
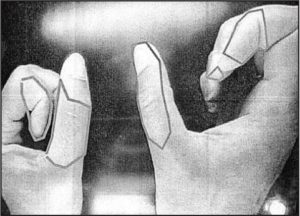
Figure 1.: Missed areas in Widmer and Dangel 2004 study.
The microbiological data only reflected the disinfection of the fingertips, despite the fact that they found missed areas in other hand regions too. To dissolve the contradiction, they suggested that the glove juice method should be more appropriate for microbiological sampling. Regardless this recognition, later studies also compared the microbiological data from the fingertip method with the fluorescent method applied on the whole hand surface (Widmer at al. 2007, Sutter at al. 2010).
Other studies focused on the glove juice technique. Reilly et al. 2016 compared the WHO 6-step and the CDC 3-step hand hygiene protocols using the fluorescent method for inspecting the coverage of the hand and the glove juice technique for determine the log10 reduction values. They found that the reduction was not related to coverage, although their studies had several serious limitations. The study started with a glove juice sampling followed by the handrub followed by another glove juice sampling. The first glove juice sampling potentially removed a large amount of bacteria before the hand rubbing, so the reduction could be overestimated. Other main limitation that this handrub, performed between the two sampling steps not used any UV-dye. For the fluorescent method, participants had to perform another hand rubbing, after the sampling procedure. They could not be certain that participants did exactly the same technique.
In addition, glove juice technique has a huge limitation in evaluating the fluorescent method; it is not specific to hand regions. It can measure the log10 reduction values, but cannot link missed areas with the elevated number of microbe.
To prove the close connection between microbiology results and hand coverage, we designed several experiments. First, we used an artificial hand, small enough to fit to a regular (7 cm) Petri dish. This hand was fabricated from plastic and covered with cow skin, to mimic the surface of the human hand.
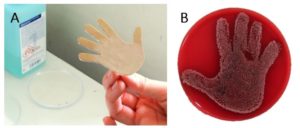
Figure 2.: A: Artificial hand designed to fit to a regular Petri dish, B: Result of the microbiological sampling when no handrub was applied.
The small hands were soaked into high concentration (0.5 McF) Staphylococcus epidermidis suspension. Some areas were disinfected with UV-marked handrub. Before sampling it to an agar plate, the hands were inspected under UV-light, recorded and evaluated by the Semmelweis Scanner. We were able to prove that regions on the hand treated sufficiently with the UV-dye containing handrub and subsequently analyzed by the Semmelweis Scanner are in fact disinfected; not developing colonies after a regular blood agar infusion and a standard 48 hours incubation time.
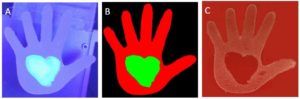
Figure 3.: A: Hand partially treated with UV-marked handrub in UV-light, B: software-evaluation by the Semmelweis Scanner; well-treated (green) and not disinfected (red) regions, C: result of the microbiological sampling.
The main limitation of our study was that the settings were far from actual clinical conditions. We repeated the experiment using real hands (and custom-developed agar plates). The experimental setting and the result were basically the same; UV-marked handrub treated areas (evaluated as clean by the Semmelweis Scanner) had no growing microorganism. Also, the hand shapes on the microbiological sample were not as clean as in the previous experiment, due to some technical issues.
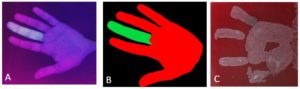
Figure 4.: A: Hand under UV-light, the middle finger was treated with UV-marked handrub. B: Evaluation by the Semmelweis Scanner; green means disinfected, red means untreated areas. C: Microbiological sample from the hand after incubation. The middle finger is missing.
Conclusion:
The fluorescent method is a great tool for educating and inspecting proper hand hygiene technique. We described how we can link the result of the fluorescent method to the microbiology. The complete validation of the fluorescent method was performed (and in publication), providing an objective background to the Semmelweis Scanner’s florescent methodology.
Read our previous post on the fluorescent method. Please stand by for our next blog entry on the potential and limitations of manual inspection.